Debate or Denial? What constitutes a valid argument?
Labels:
astrophysics,
galactic winds,
galaxies,
scientific method,
x-rays
I was not going to discuss the Hopkins/Iraqi mortality study recently published in the Lancet (as its methodology is outside my experience in statistics, and there are already a lot of good analyses of the fallacies in the naysayers arguments), but I saw an interesting comment by Zeyad of Healing Iraq (that This ModernWorld had picked up on) that is actually quite a nice explanation of what makes for a real scientific debate verse simple (unscientific) denial:
One problem is that the people dismissing – or in some cases, rabidly attacking – the results of this study, including governmental officials who, arguably, have an interest in doing so, have offered no other alternative or not even a counter estimate. This is called denial. When you have no hard facts to discredit a scientific study, or worse, if you are forced to resort to absurd arguments, such as “the Iraqis are lying,” or “they interviewed insurgents,” or “the timing to publish this study was to affect American elections,” or "I don't like the results and they don't fit into my world view, therefore they have to be false," it is better for you to just shut up.
This is just as true in the physical sciences, e.g. astrophysics, as it is in the medical/social sciences. In astronomy, much of it an observational science, there are as many claims made based on human interpretation of images ("by eye" as we'd say) as there are based on quantitative measurements based on the data.
I've just been mulling over one such issue, which I'll present part of just for fun as to get some real superwind stuff into this blog (and as an antidote to all the complaining about the woes of the space program).
For me the issue is whether the soft X-ray emission in superwinds (which are galaxy sized winds of gas flowing out of star-forming galaxies, I'll do a better into some time later) comes from the stuff drivin the wind itself, or is just a tracer of its interaction with the ambient medium. By way of analogy, think of a dust devil or tornado. What you see in a tornado is only a tracer of the actual thing powering it, you see debris (dust, water vapor, leaves, bits of houses etc) carried along by the motion of the wind - you don't actully see the air molecules themselves.

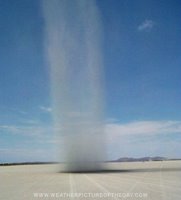
This image is of a dust devil. Notice how there seems to be more dust a the left and right-hand edges of the devil than in the center? In astronomy we would call this limb-brightened (limb as in edge, not as in arm or leg). If you imagine looking down on the devil from above you might seem an approximately circular structure, with a central circle of nearly clear air (little dust) surrounded by an annulus of dusty air.
Now that was an interpretation based purely on a qualitative argument - I looked at the image and interpreted it based on my scientific experience and came up with an hypothesis based on the dust devil looking (by my eye) to be limb brightened.
But could I test this hypothesis rather more quantitatively? Well, I could construct a mathematical model of the 3-dimensional geometry and distribution of dust, calculate how that would look projected into 2-dimensions (i.e. an image) and compare that to the data (the image).
What if someone said that the dust devil didn't look limb brightened to them? Say they though it was pretty uniformly dusty from left to right and that they though this meant it was uniformly filled with dust. Well, rather than a meaningless he said/she said argument what we'd have to do is measure the amount of dust from left to right [Note: A uniformly filled cylinder would actually appear to have more dust in the center when seen in projection].
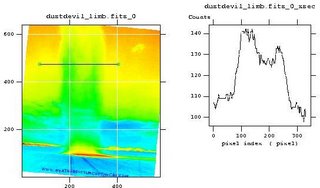
Just for fun I've rotated the dust devil image by 5 degrees (to make the dust devil more nearly vertical) and written it out as a FITS file using the gimp, so I can use some standard astrophysical software (the wonderful fv) to probe the image quantitatively. Then I've just taken a horizontal cut accross the evil and plotted the brightness in a X-Y graph. As the dust is brighter than the sky then the image brightness is roughly a measure of the amount of dust.

As you can see the edges are brighter (have more dust) than the center, so this is evidence for limb-brightening. One side is slightly brighter than the other, which tells us there are assymetries in the dust distribution, but to first order its OK just to say its limb-brightened.
In astronomy we often have to compare data taken with difference telescopes at different times, which makes things a bit more complicated. The different telescopes often will differ in sensitivity, in the wavelengths of light they're most sensitive too, and in their spatial resolution (how sharp the images are), not to mention that the astronomical source itself might have actually changed its state in the time between the different observations.
Imagine if we'd taken a picture of the dust devil with a rather blurry camera. Then it would be harder to see evidence for limb-brightening.

Just for fun, here is that image again, now blurred so as to represent a lower spatial resolution observation (I haven't added the noise you'd actually get in a new observation). You can see the same general shape as before, but note that the evidence for limb-brightening is weaker - the peak to trough amplitude (dust devils edges to center) in the profile on the right hand side is much less than the earlier full-resolution image. If I'd blurred the image even more you wouldn't see any evidence for limb brightening. But it doesn't mean it isn't there - in this case by blurring the image we're using an effective spatial resolution too low to be able to test the hypothesis of limb-brightening.
Could we use data from the second camera to argue against the limb brightening seen in the first camera? The answer, which might surprise you, is a qualified yes. Sure the instrument itself might be not as well suited to the question we're trying to anser, but nonetheless if we got really good data we could try to quantitatively compare the two images, if we make sure to accounht for the difference in instrument capability. But you would need to work harder to prove it, you couldn't just say "well, doesn't look limb brightened in our lower resolution data, therefor the interpretation using the better camera is wrong".
Of course, no practising professional scientist would be so lazy as try a flat-out unsubstantiated denial, would they?


No comments:
Post a Comment